Home / A. Equitable Growth Framework Manual / Equity Metric #3: Access to Employment Opportunity
Manuals and Metrics
Table of contents
Equity Metric #3: Access to Employment Opportunity
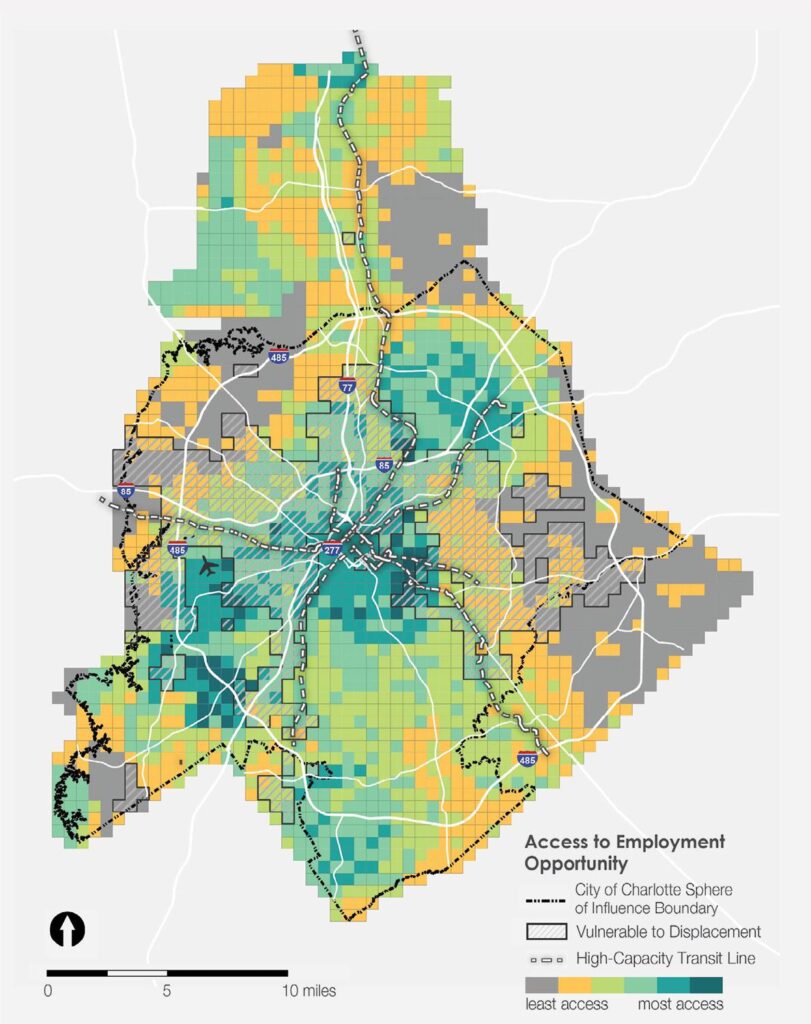
The access to employment opportunity index identifies areas with a lack of employment opportunities for residents. Employment Opportunity, for the purposes of this analysis, is defined as the ability for residents to live proximate to jobs that are attainable for a variety of residents and provide a living wage. For the sake of measuring access to employment opportunity, a commute shed is defined as a 20-minute (2.5 mile) radius from a residence.
Access to Employment Opportunity is analyzed using five measures:
- Proximity to Employment;
- Employment in Commute Shed;
- Wage Levels;
- Middle Skill Jobs; and
- Knowledge Based Jobs.
Data: Grid cells that meet the “opportunity” criteria for each of the 5 metrics are scored with a 1, while those that do not meet the criteria receive a 0. Scores are added to create a final Access to Employment Opportunity score. All employment metrics are measured using US Census Longitudinal Employer-Household Dynamics (LEHD) employment data (2017). Data is reported at the Census Block level, and aggregated to grid cells based on the centroid location of each Block.
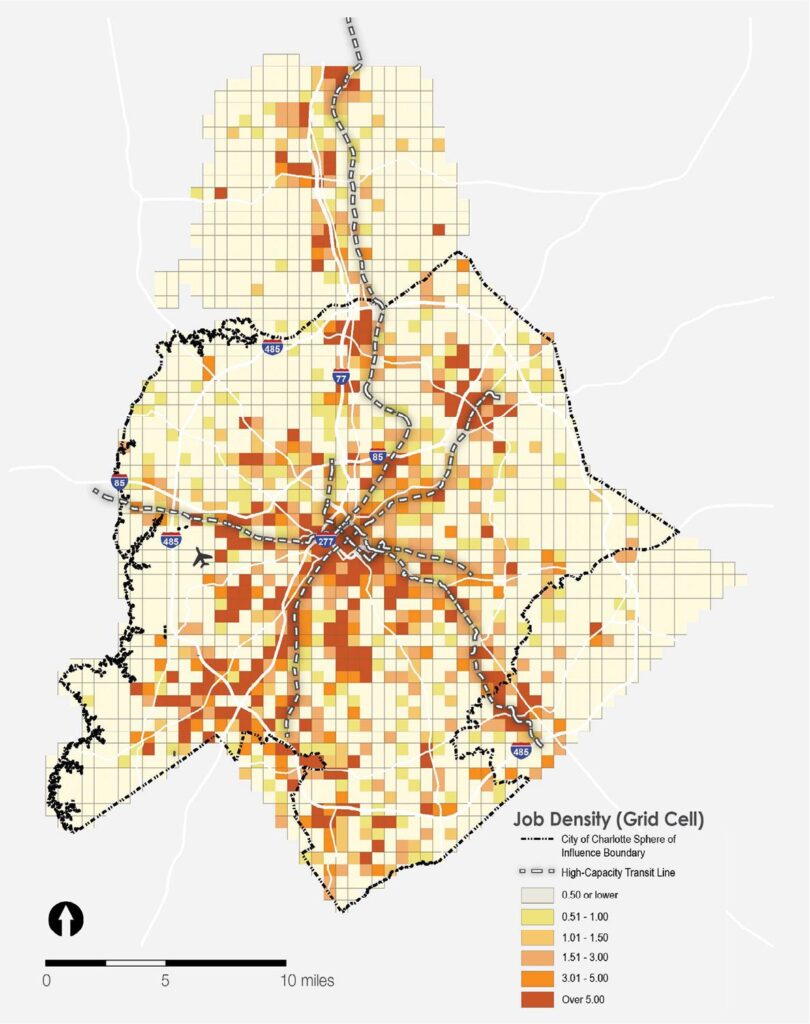
Proximity of Employment
This measure examines the job density within each grid cell, measured as the number of jobs per acre. As shown in the map at right, job density is highest in the center city, as well as in the areas of UNC Charlotte, South End, and along major corridors. Areas with over 1 job per acre are considered to have access to employment opportunity.
Map below: Grid Cell Job Density (Jobs per Acre), 2017
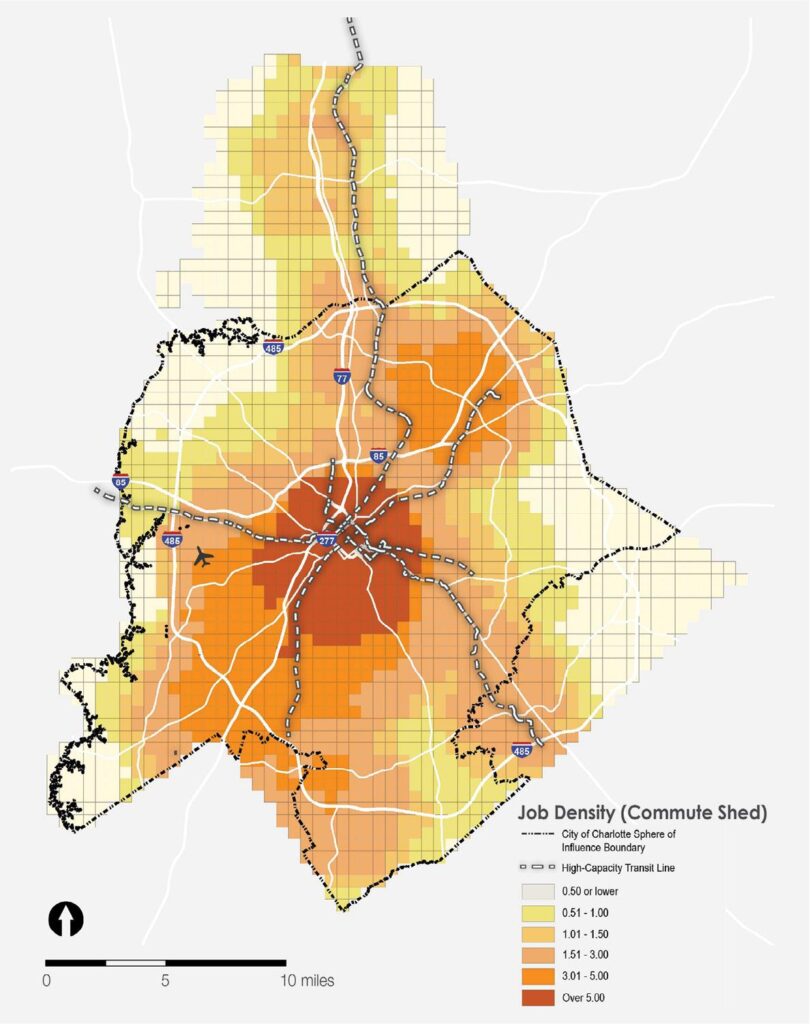
Employment in Commute Shed
This measure examines the job density within a 2.5 mile area surrounding each grid cell, to indicate the accessibility of jobs within an approximate 20-minute commute shed. This is measured as the jobs per acre within a 2.5 mile buffer of each grid cell (including jobs within each cell). As shown in the map at left, accessibility of jobs is highest in the center city and generally decreases with distance from the center. There is an additional concentration of jobs accessible around UNC Charlotte. Areas with a job density within a 20-minute commute shed greater than 1.0 jobs per acre are considered to have access to employment opportunity.
Map below: Commute Shed Job Density (Jobs per Acre), 2017
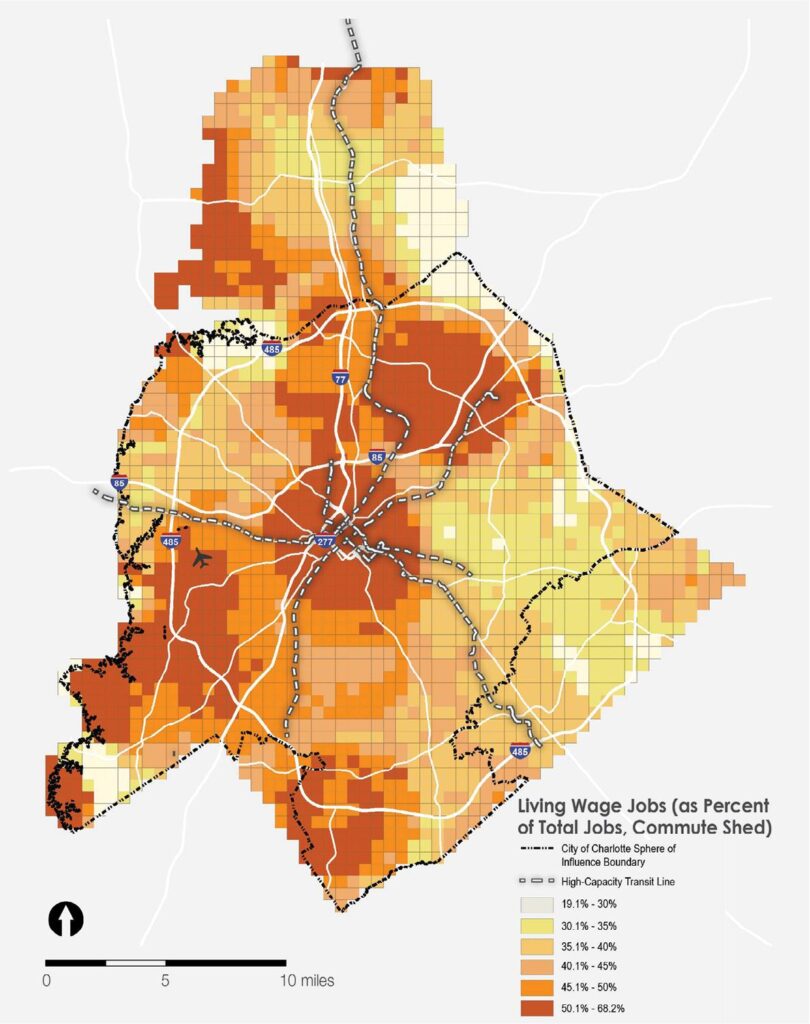
Wage Levels
This measure examines the wages of the jobs accessible within each grid cell’s commute shed. Jobs are categorized into low wage (less than $40,000 per year) and living wage ($40,000 per year or more). As show in the map at right, accessibility of living wage jobs is concentrated in and around the center city and UNC Charlotte, as well as in pockets of the south, southwest, and northwest. Areas where more than half of jobs pay a living wage are considered to have access to employment opportunity.
Map below: Commute Shed Wage Levels (Percent of Jobs with Wages Over $40,000), 2017
Middle Skills Jobs
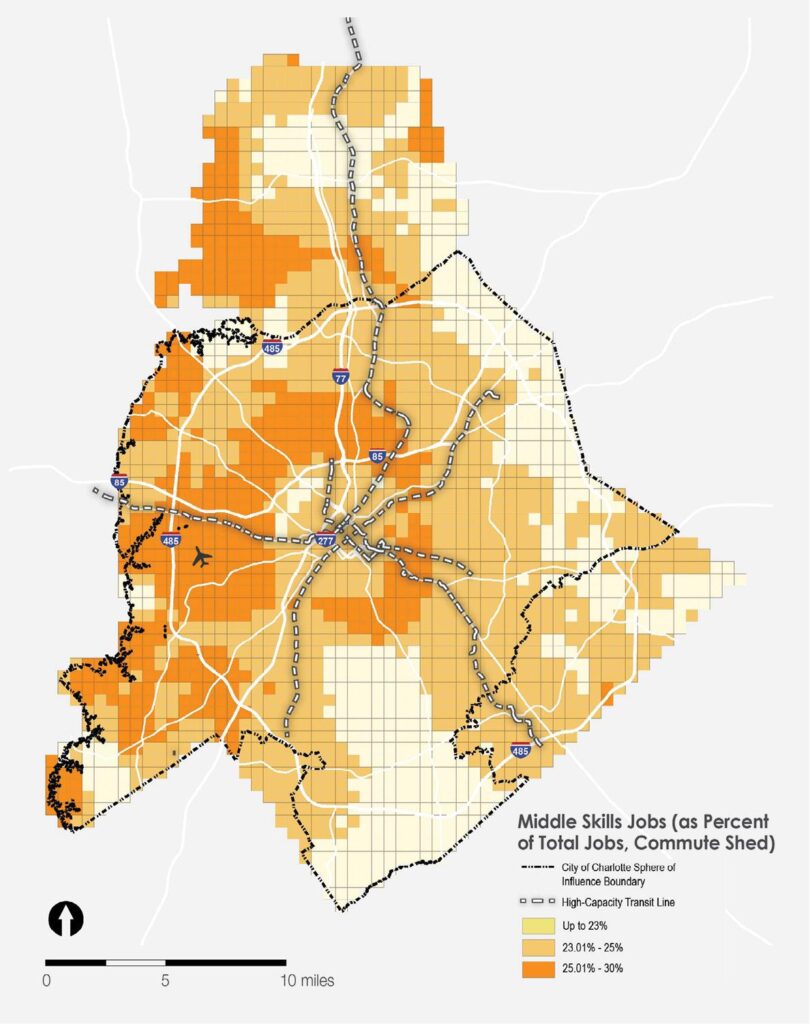
This measure examines the accessibility of jobs for the “middle skills” workforce – those jobs that only require some post-high school education or training within the commute shed of each grid cell. As shown in the map at left, in most areas between 20 and 30 percent of jobs are available for this workforce, with concentrations in the area surrounding the center city, as well as at the airport and along the western edge of the City. Areas where greater than 25% of accessible jobs are considered “Middle Skills” are areas with economic opportunity.
Map below: Commute Shed Middle Skills Jobs (Percent of Jobs Requiring Some Post-High School Education), 2017
Knowledge Based Jobs
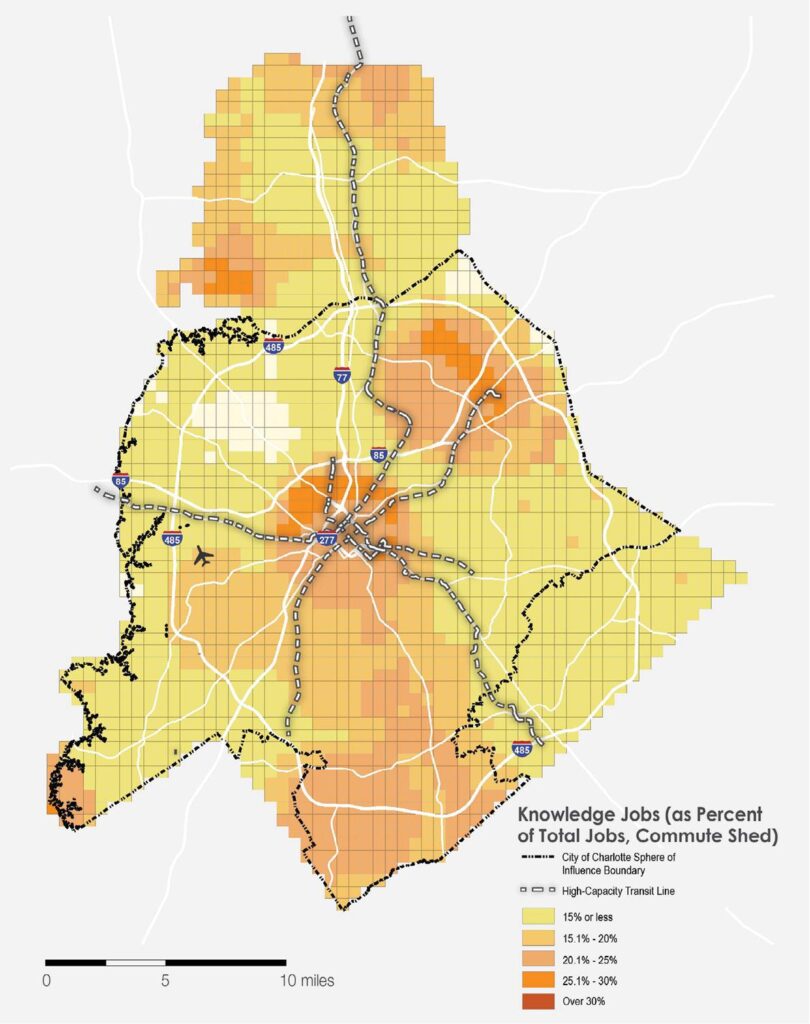
This measure examines the accessibility of jobs requiring a 4-year college degree or higher education within the commute shed of each grid cell. As shown in the map at right, accessibility of these jobs is concentrated around the center city, UNC Charlotte, and Ballantyne. Areas with over 20 percent of jobs that are Knowledge Jobs are considered to have access to economic opportunity.
Map below: Commute Shed Knowledge Jobs (Percent of Jobs Requiring a 4-year Degree or Higher Education), 2017
Future Access to Employment Opportunity Metrics to Consider
The following data sets were not included in the measurement of Access to Employment Opportunity for various reasons including lack of available data, poor data quality, or out of date information. If these data sets become more useable and accurate in the future, they should be considered for use in the Access to Employment Opportunity Equity Metric.
- Access to Newcomer Services
- Language Barriers
- Workplace Core/Soft Skills
- Segregated Social Networks
