Home / A. Equitable Growth Framework Manual / Equity Metric #2: Access to Housing Opportunity
Manuals and Metrics
Table of contents
Equity Metric #2: Access to Housing Opportunity
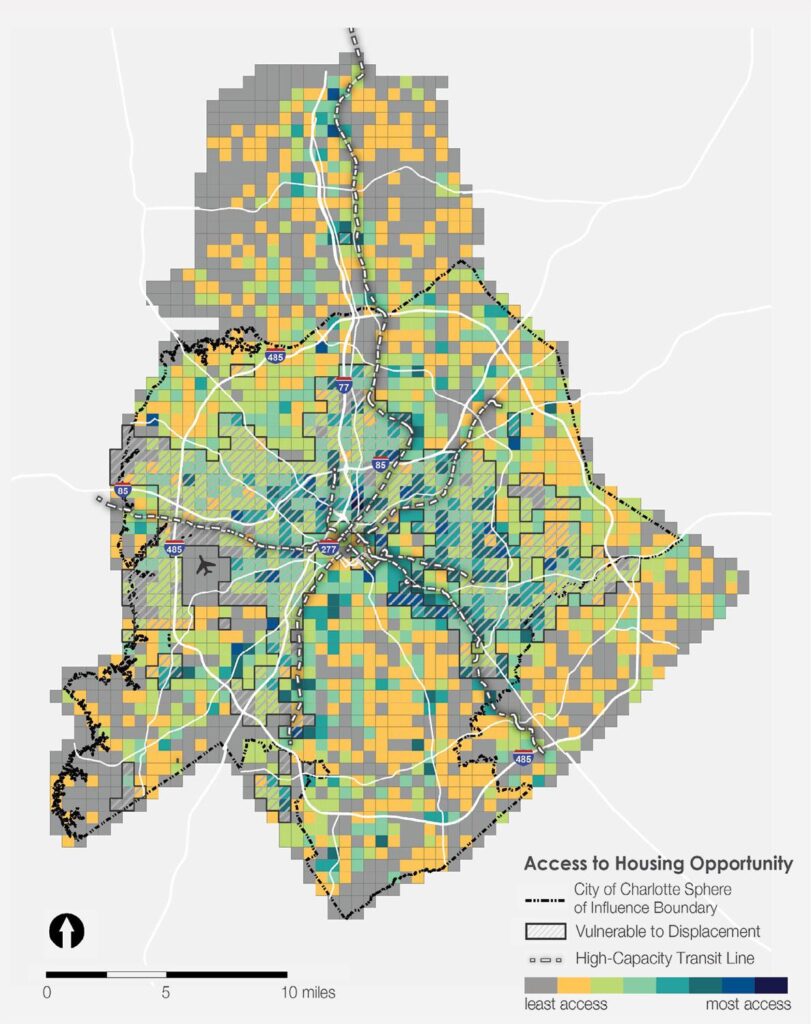
The Access to Housing Opportunity index identifies areas where the housing stock does not provide opportunities for all residents to live. Housing Opportunity, for the purposes of this analysis, is defined as the ability for residents of all income, household compositions, and life stages to access housing options that meet their needs and economic conditions.
Access to housing opportunity is analyzed using six measures:
- Housing Unit Diversity;
- Housing Cost;
- Housing Size;
- Subsidized Housing;
- Tenure; and
- Level of (Re)Investment.
Data: Grid cells that meet the “opportunity” criteria for each of the 6 metrics are scored with a 1, while those that do not meet the criteria receive a 0. Scores are added to create a final Access to Housing Opportunity score. The primary housing data source is Mecklenburg County tax parcel data (2019). Additional data includes building permits (Mecklenburg County, 2017-2019), rental housing (apartment) properties (City of Charlotte, 2020), subsidized housing units (units with development-based rental assistance, Quality of Life Explorer, 2017), and household income (US Census, 2018).
Housing Unit Diversity
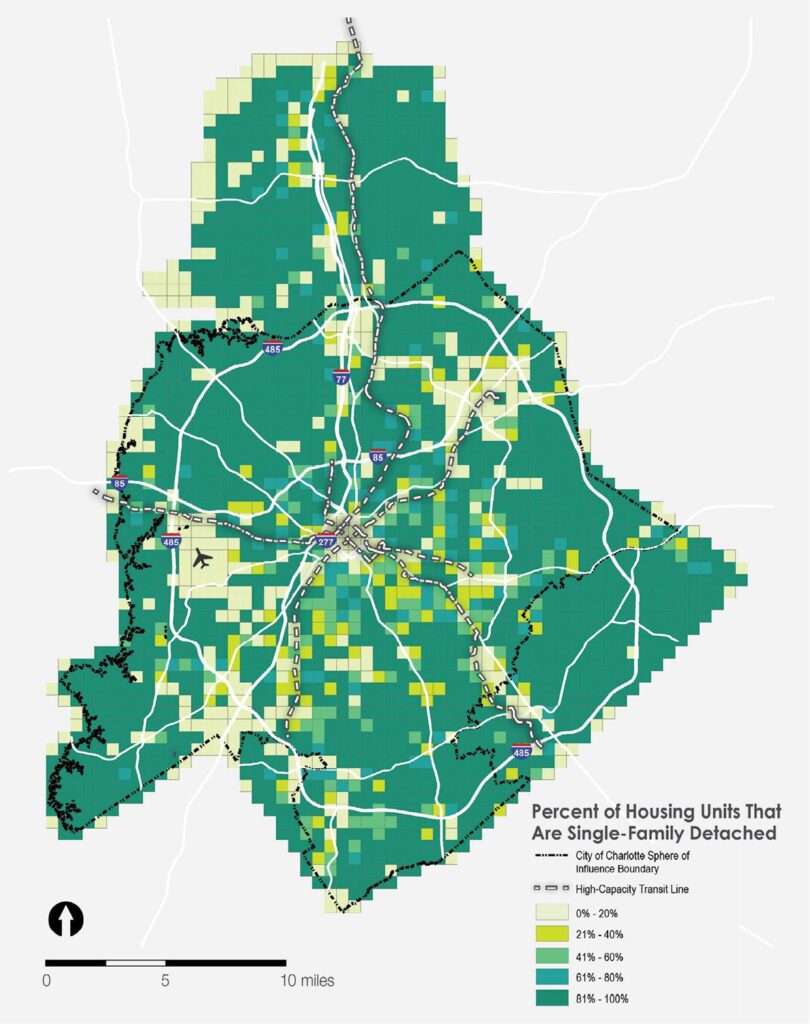
This measure examines the mix of housing types in an area through the percentage of housing units that are single-family detached homes. Areas that are primarily comprised of single-family detached homes and areas that have relatively few single-family detached homes are considered to have less opportunity than areas with a mix of unit types. As shown in the map at right, the center city and the area around UNC Charlotte have comparatively few single-family detached homes (20 percent or less of the housing stock), while in much of the city these homes account for over 80 percent of homes. Areas with between 20% and 80% of housing units single-family detached are considered to have a diversity of housing units.
Map below: Single-Family Detached Homes as Percent of Housing Units
Housing Cost
This measure examines the average housing costs in an area relative to the affordable housing cost for a household earning the citywide median household income for renter households. The median income for renter households in the City of Charlotte in 2018 (the most recent year of data) was $47,650, far lower than the overall median of $60,760 and the homeowner median of $80,380. Utilizing the renter median income highlights the areas that currently offer the most and least access to affordable housing options. Areas with homes that are affordable to the citywide median-earning renter household are considered to have access to housing opportunity. Housing cost includes three sub-metrics: cost for ownership housing; affordability; and cost for rental housing.
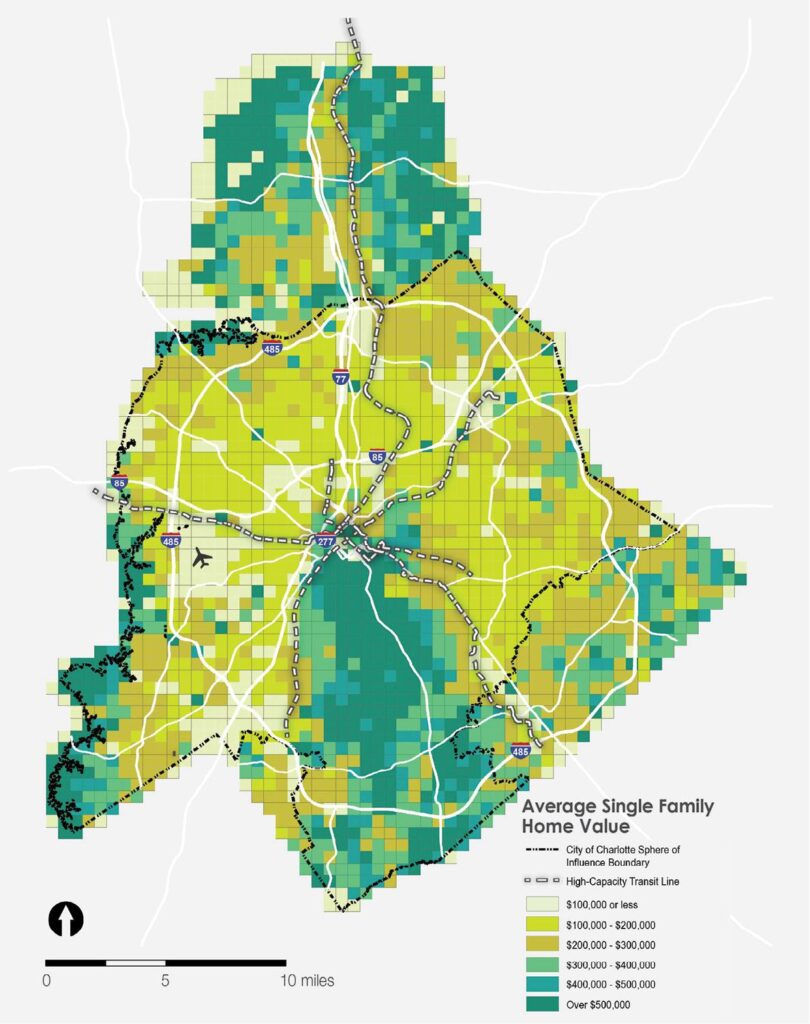
For ownership housing, this compares the income required to afford the average home (measured by the average value of single-family detached homes) in a grid cell to the citywide median income to determine whether homes in the area are affordable to the median-earning renter household, examining the opportunity for households that are currently renting to purchase a home. Cost calculations assume a 30-year loan with 5% down and 4% interest, and account for annual insurance, property tax, and other miscellaneous (e.g. HOA dues) costs. The map at left shows the existing distribution of home values for single-family homes (detached, townhome, duplex, and triplex). This reinforces the crescent and wedge pattern seen in other data in the city, emphasizing the concentration of home values in certain areas.
Map below: Average Single-Family Home Value (Detached, Townhome, Duplex/Triplex)
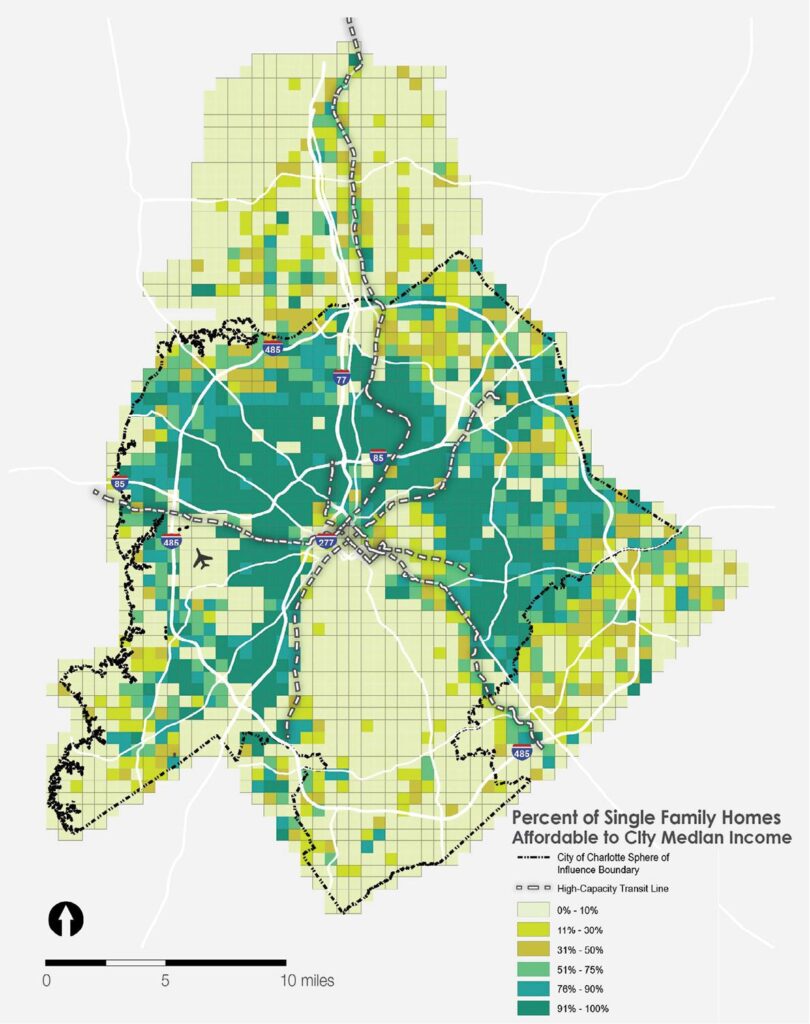
The map at right shows the percent of single-family homes in a grid cell that are affordable to a household earning the median renter household income. As shown, affordable single-family homes are concentrated in the “crescent” of the city; while this is an indicator of opportunities for households currently renting their homes to afford the purchase of a home, it should be noted that it is also an indicator of historic investment and policy decisions. The vulnerability analysis (presented further on in this document) that will be used as an overlay to the opportunity areas will help inform the types of policies and strategies that will be most useful to utilize these results with consideration to both existing populations and future growth. For this opportunity metric, areas where over 30% of single-family homes are affordable are considered to have access to housing opportunity.
Map below: Percent of Single-Family Homes Affordable to a Household Earning the City Median for Renters
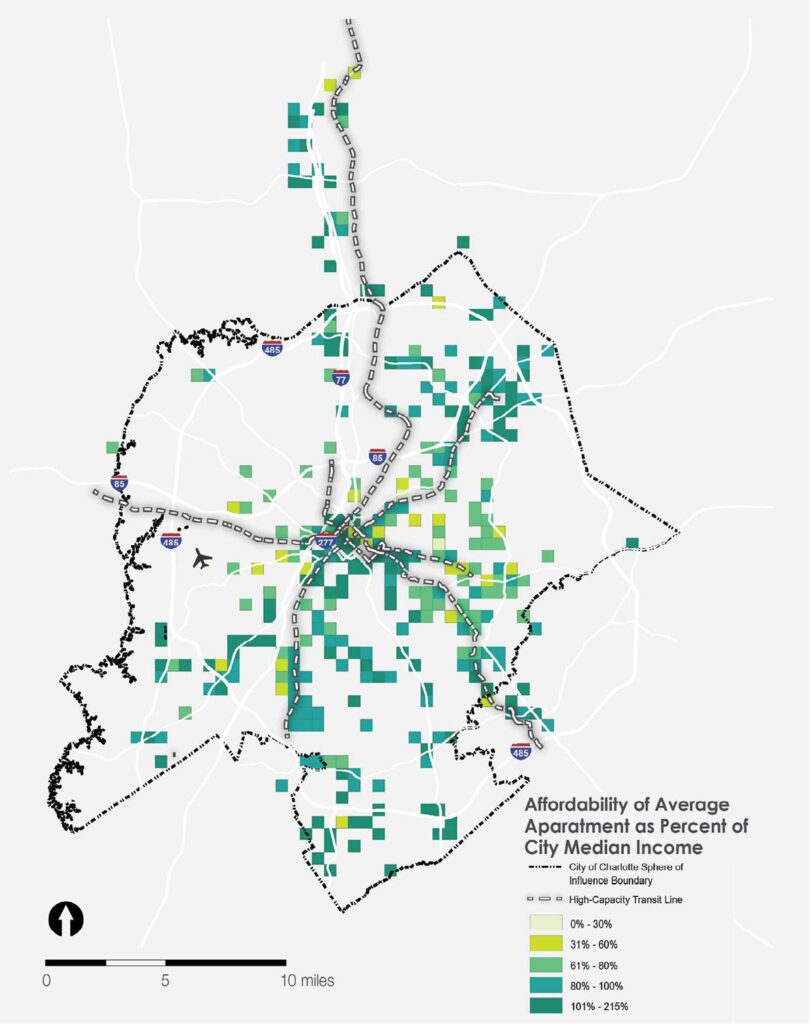
For rental housing, this metric compares the income required to afford the average per-unit rent in a grid cell to the citywide median income for renter households to determine whether rental units in the area are affordable to the median-earning household. Affordability calculations assume 30% of income spent on rent. Map at left shows the income required to afford the average apartment rent in a grid cell as a percentage of the city median income (note that due to data limitations, rental rates are not available for every property; however, properties missing rent information are geographically dispersed throughout the region, minimizing the impacts on the overall metric). As shown, apartments in the center city, near UNC Charlotte, and along major corridors are less affordable, requiring a household to earn at least the median renter income ($47,650). Areas that are affordable to households earning less than 100% of the citywide median renter income are considered to have access to opportunity.
Map below: Income Required to Afford Average Apartment Rent, as Percent of City Median for Renters
Housing Size
This measure examines the average size of housing units in an area to identify areas with options for a diversity of homeownership (i.e. smaller single-family detached homes) and family-size rental units (i.e. larger apartments). Areas with access to these housing options are considered to have access to housing opportunity. Housing size includes two sub-metrics: size of ownership housing; and size of rental housing.
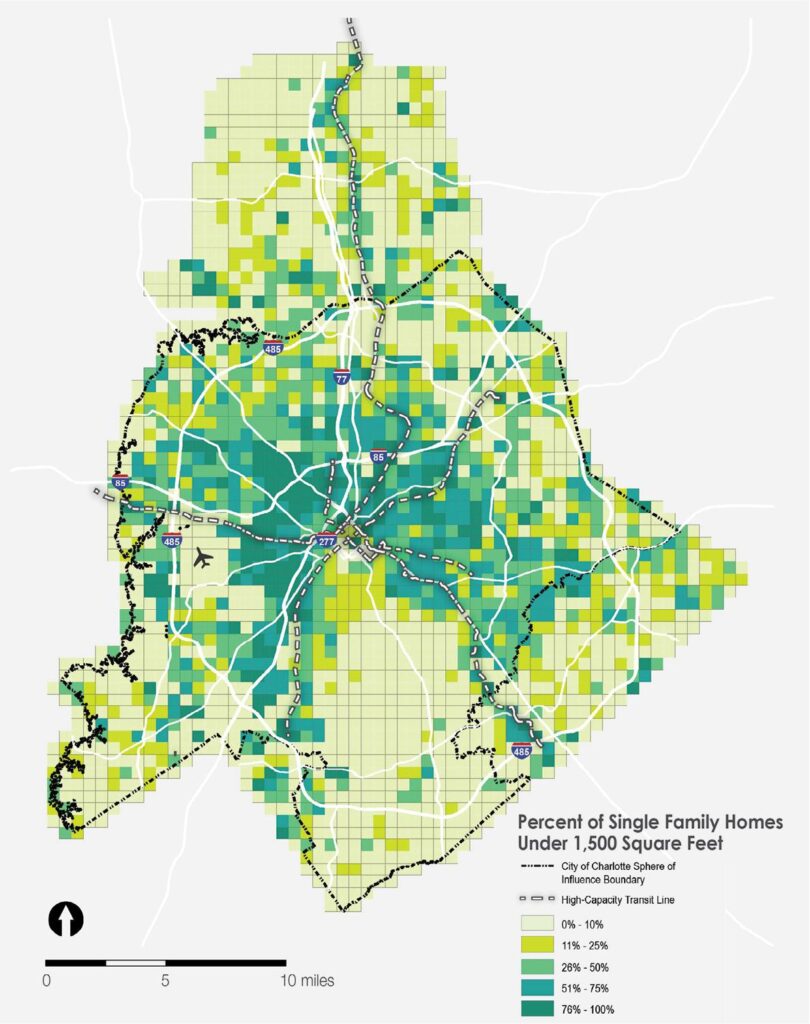
For ownership housing, this is measured using the average heated square footage of single-family homes in the area. For this metric, single-family homes include detached, townhomes, and duplex/triplex homes. As shown in the map at right, smaller homes are more prevalent in the “crescent” to the north of the center city. A home under 1,500 square feet in size is considered an indicator of a housing stock that provides opportunities for a diversity of homeowners (e.g. first-time buyers, individuals, young couples/families, older people looking to downsize) and grid cells where over 25% of homes are under 1,500 square feet are considered to have access to opportunity.
Map below: Percent of Single-Family (Detached, Townhome, Duplex/Triplex) Homes Under 1,500 Square Feet
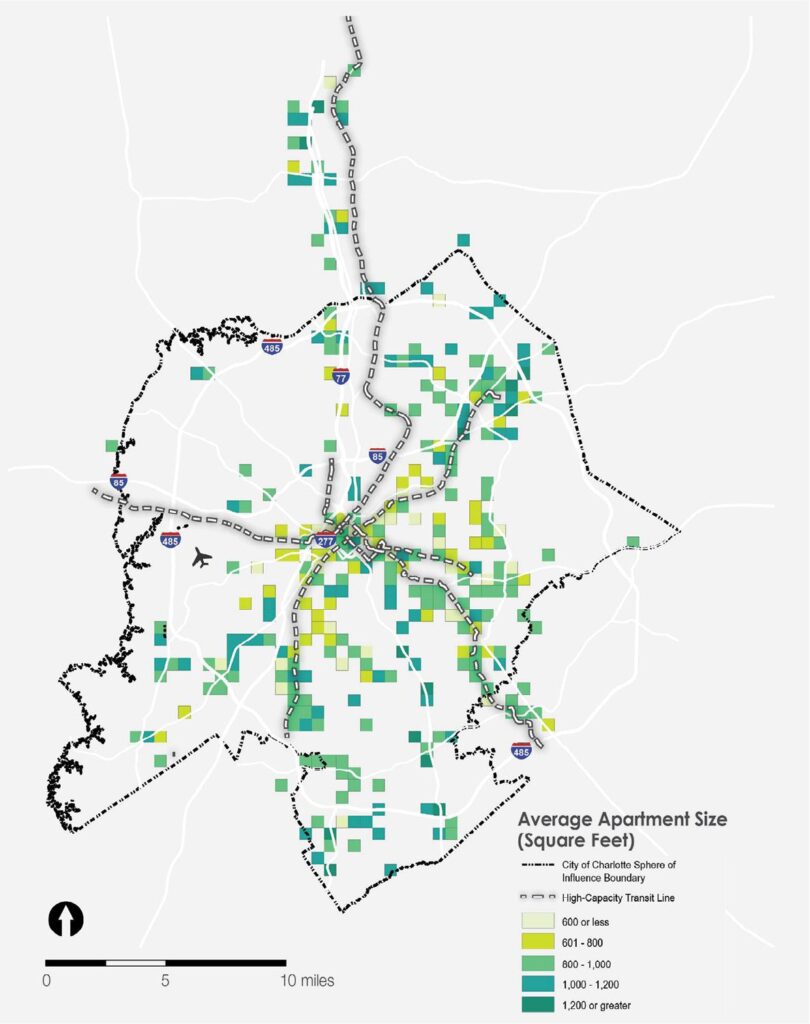
For rental housing, this is measured using the average unit square footage of apartments in the area. As shown in the map at left, there is variation in average apartment size across the city, however in general smaller apartments are concentrated closer to the center city (note that this dataset only includes institutional apartment buildings, and those grid cells without buildings are not shown). This analysis assumes a 1,000 square foot is minimum for a 3-bedroom (family) apartment. Areas where the average unit size is greater than 1,000 square feet are considered to have a supply of family-oriented rental units.
Map below: Average Apartment Size, by Building (2020)
Subsidized Housing
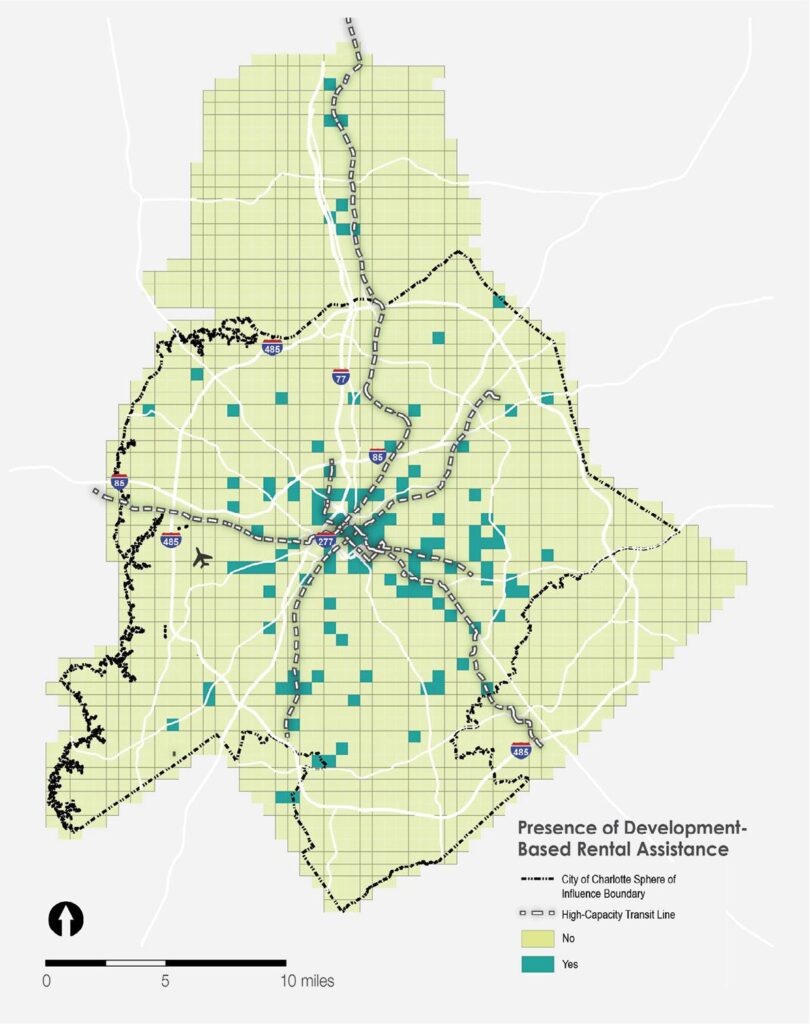
This measure examines the affordable housing available in an area through the presence of development-based rental assistance. This metric is based on the data underlying this measure in the Quality of Life Explorer, and includes properties with Low-Income Housing Tax Credits, public housing developments of the Charlotte Housing Authority, developments of the Charlotte-Mecklenburg Housing Partnership, developments with funding from the Charlotte Housing Trust Fund, developments with active Section 202 Direct Loans for housing for the elderly or handicapped, units with active Project-Based Rental Assistance Section 8 Contracts through the U.S. Department of Housing and Urban Development (HUD), and units with active HOME Rental Assistance subsidies through HUD. As shown in the map at right, these developments are relatively dispersed throughout the city. Areas where there is a presence of development-based rental assistance are considered to have access to housing opportunity.
Map below: Presence of Development-Based Rental Assistance, 2017
Tenure
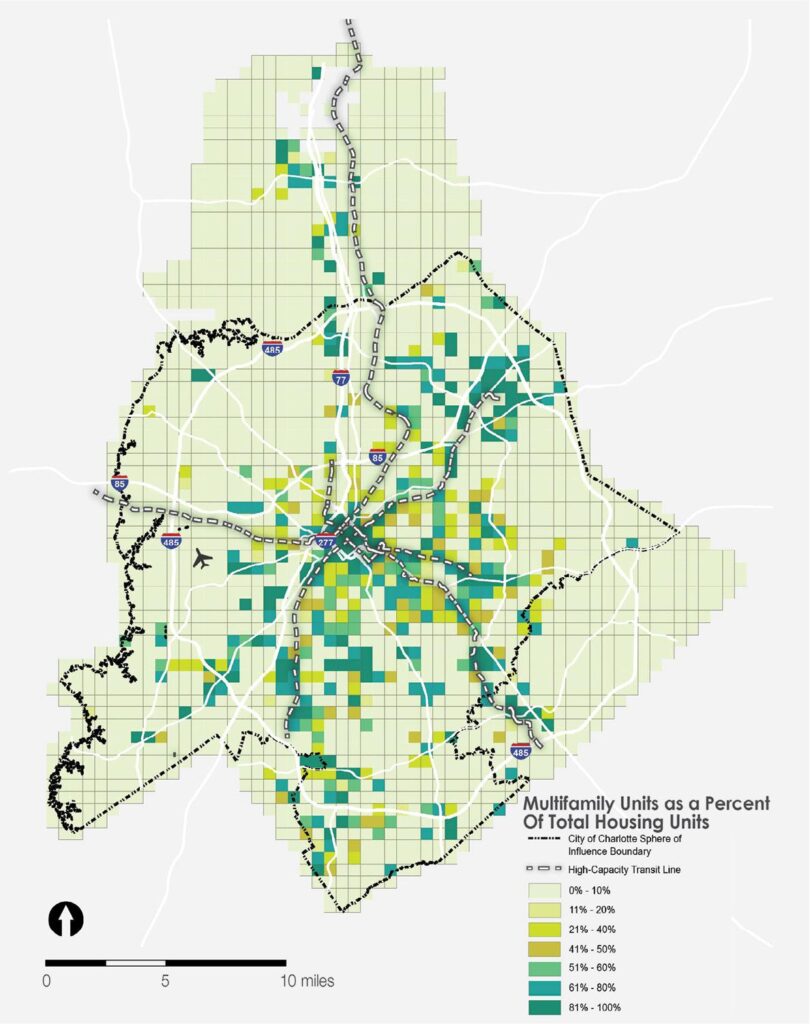
This measure examines the mix of ownership and rental housing in an area. This is a parcel-based measure that (due to data constraints) assumes that “multifamily” units are rented and all others are owned. As shown in the map at left, in many areas of the city multifamily housing accounts for 10% of less of the housing inventory. For this metric areas with a mix of tenure are considered to have opportunity, and those grid cells where between 20% and 80% of housing units are multifamily are considered areas with housing opportunity.
Map below: Multifamily Housing as a Percent of All Housing Units
Level of (Re)Investment
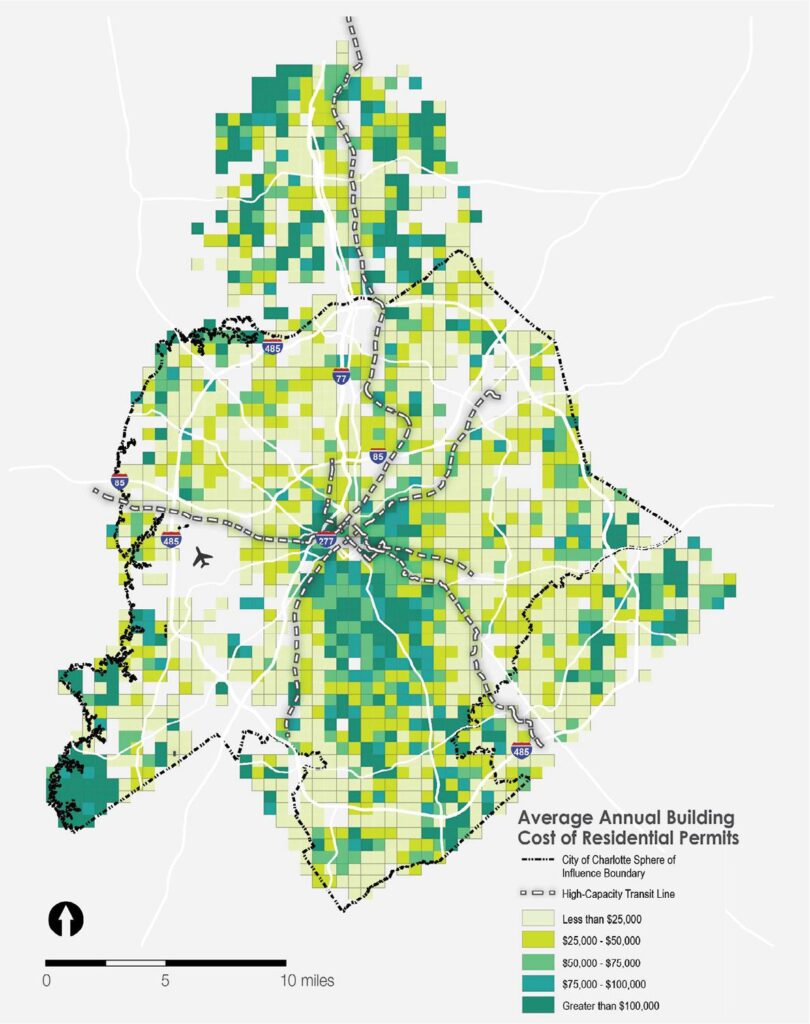
This measure examines the level of increased investment into the existing housing stock of an area in order to identify areas that are attracting investment at a rate that does not significantly change the age and composition of the housing stock. This is assessed based on the value of permits for new units and renovations (calculated as the average of the past 3 years to account for single year fluctuations). Areas where there are very low or very high levels of investment are considered to lack opportunity. As shown in the map at right, the per-permit value is higher to the south of the central city, as well as in pockets on the city edges, while there are many areas where the average level of investment per unit is less than $25,000. For this analysis, areas with an average per-permit cost of between $25,000 and $100,000 are considered to provide access to housing opportunity.
Map below: Average Per-Unit Value of Residential Permits (2017-2019 Annual Average)
