Home / A. Equitable Growth Framework Manual / Equity Metric #4: Environmental Justice
Manuals and Metrics
Table of contents
Equity Metric #4: Environmental Justice
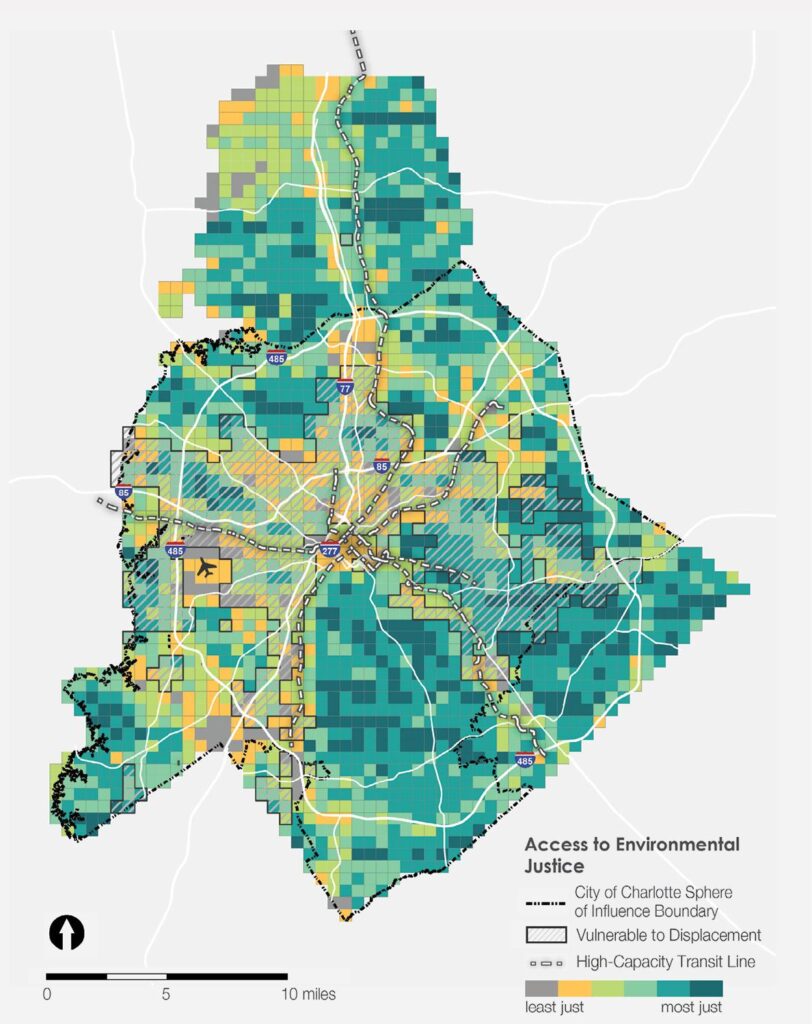
Environmental justice (EJ) seeks to minimize and equalize effects of environmental hazards among the entire community regardless of income, ethnicity or race. Issues of environmental justice often arise from geographic or procedural inequities. Geographic inequities occur when neighborhoods with high percentages of low-income residents, minority residents, and/or immigrant communities take more than their share of the worst environmental hazards, nuisance impacts, and resulting health problems from exposure to these hazards. Procedural inequities occur when the same neighborhoods face obstacles to meaningfully participate in the decision-making process for projects that directly affect their neighborhoods.
Many factors contribute to these geographic and procedural inequalities. These include a development pattern that concentrates undesirable or unhealthy land uses in certain areas, the placement of desirable public amenities outside of disadvantaged communities and limited or non-existing political influence among certain demographic groups. The following measures – focused on aspects of the built environment – are proposed to couple with the Populations Vulnerable to Displacement metric to measure environmental justice (or injustices as the case may be).
Environmental Justice is analyzed using five measures:
- Tree Canopy;
- Impervious Surface;
- Proximity to Heavy Industrial Uses (including extraction operations (i.e., quarries));
- Proximity to Major Transportation Infrastructure; and
- Floodplain.
Data: Grid cells that meet the environmental justice criteria for each of the 5 metrics are scored with a 1, while those that do not meet the criteria receive a 0. Scores are added to create a final Environmental Justice score. Environmental justice data sources include a tree canopy study (Mecklenburg County, 2016), impervious surfaces (Mecklenburg County, 2020), zoning (heavy industrial zoning districts, City of Charlotte, 2020), major transportation infrastructure (freeways, expressways, railroads and the airport, Mecklenburg County, 2020), and FEMA Existing 100 Year Floodplain (Mecklenburg County, 2020).
Tree Canopy
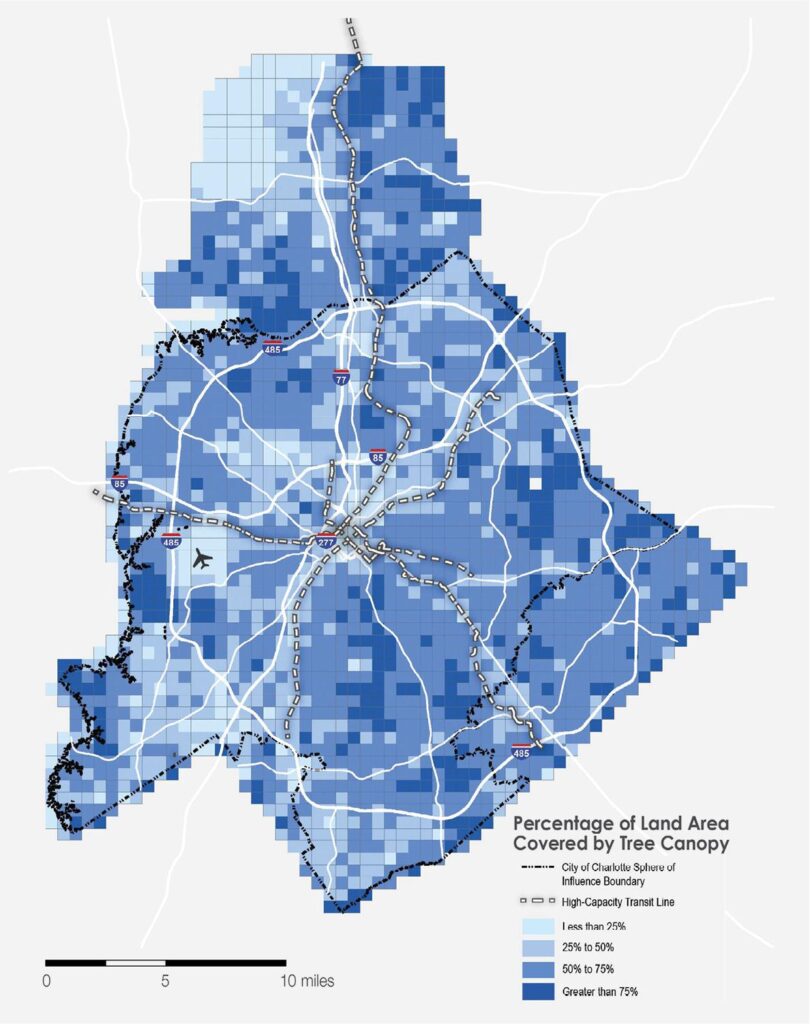
This measure examines the percentage of land area covered by tree canopy. Areas with over 50% percent of land area covered by tree canopy are considered to the positive environmental effects of tree canopies.
Map below: Percentage of Land Area covered by Tree Canopy
Impervious Surface
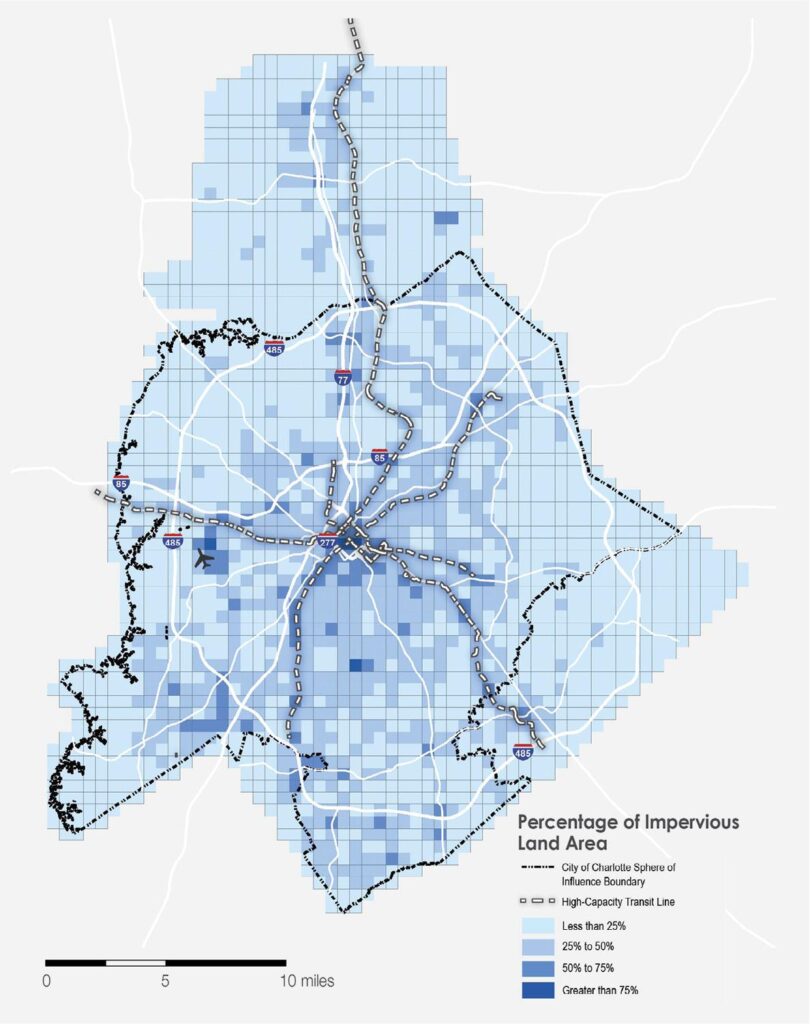
This measure examines the percentage of land area that is impervious. Areas with 25% or less impervious land (<40 acres) are considered to have equitable access to the positive environmental effects of pervious surfaces.
Map below: Percentage of Land Area that is Impervious
Proximity to Heavy Industrial Uses
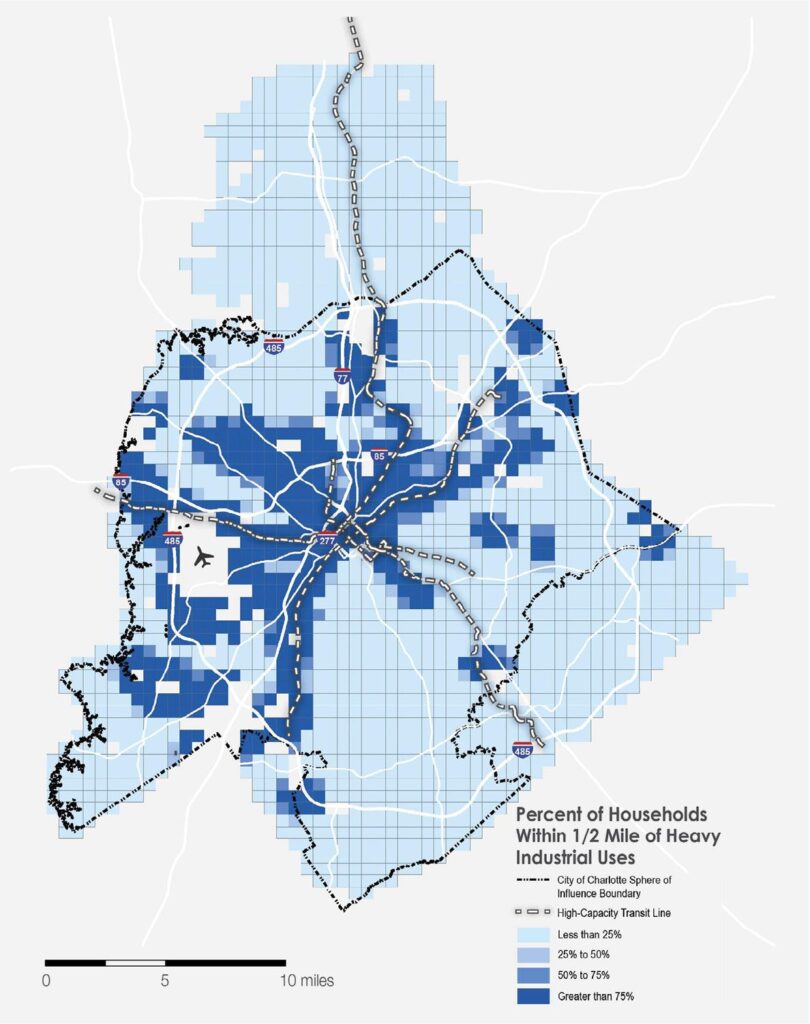
This measure examines the percentage of households within ½-mile of heavy industrial uses. Areas with less than 25% of households within ½ mile of heavy industrial are considered to have minimal exposure to the negative environmental effects of heavy industrial uses.
Map below: Percentage of Households within ½ Mile of Heavy Industrial Uses
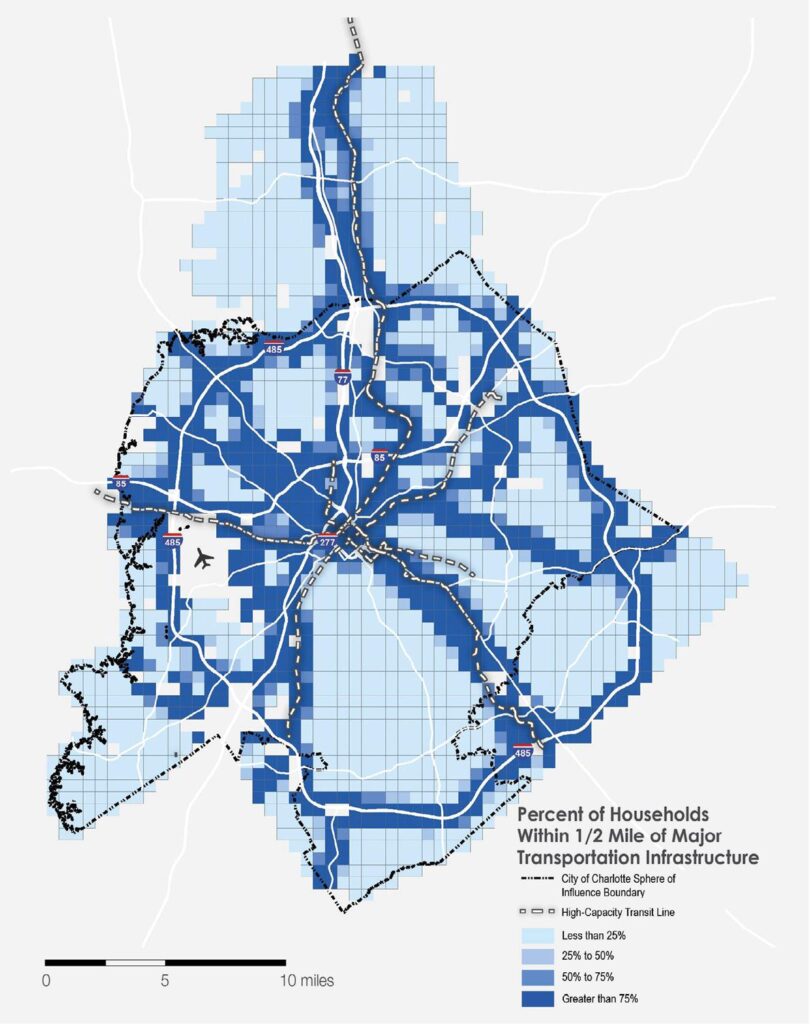
Proximity to Major Transportation Infrastructure
This measure examines the percentage of households within ½-mile of freeways, expressways, railroads and/or the airport. Areas with less than 50% of households within ½ mile of major transportation infrastructure are considered to have minimal exposure to air and noise pollution. This metric can also be used to analyze the relationship major transportation infrastructure (existing or planned) and vulnerability to involuntary displacement.
Map below: Percentage of Households within ½ Mile of Major Transportation Infrastructure
Floodplain
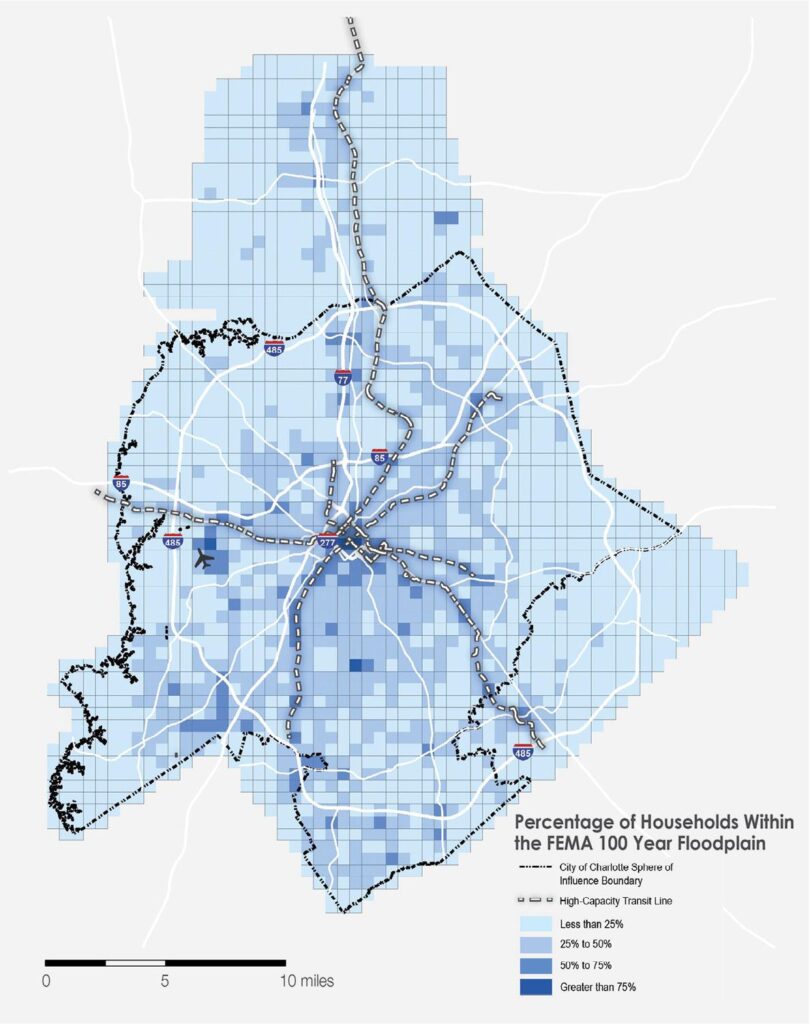
This measure examines the percent of Households within the Floodplain. Areas with less than 25% of households within the Floodplain are considered to have minimal exposure to the risks of the flooding.
Map below: Percentage of Households within the Floodplain
Future Environmental Justice Metrics to Consider
The following data sets were not included in the measurement of Environmental Justice for various reasons including lack of available data, poor data quality, or out-of-date information. If these data sets become more usable and accurate in the future, they should be considered for use in the Environmental Justice Equity Metric.
- Charlotte Douglas Airport Flight Patterns
- Noise Contours
- Carbon Footprint
- Impact on Climate Change
